Game 3
Reduced variability
Click "start" on the above to begin.
An introduction and review of the game is given below.
An introduction and review of the game is given below.
In this next dice game we can explore the impact of reducing variability at either one or a number of stages in the system.
You will see that against each person a range of either 1-6 or 3-4 is highlighted. If you click on box you can change the highlighted range. If the selected range is 3-4 then that person's throw will be limited so that if they traditionally throw a 1, 2 or 3 it would be counted as 3, and if they throw a 4, 5 or 6 this would be counted as a 4. So, the AVERAGE perfomance of that person remains the same at 3.5 but the variation has been reduced so that it simply oscillates between 3 and 4.
You can set this reduced variation for either one step in the system, many steps in the system or even all steps in the system, and explore what happens to both the throughput and the number of people in the system during the game.
Try a number of different techniques to reduce variation and see what impact it has on throughput. In particular, explore on how many work stations you have to reduce the variability before you see a significant improvement in throughput.
Game 3 behaviour and analysis
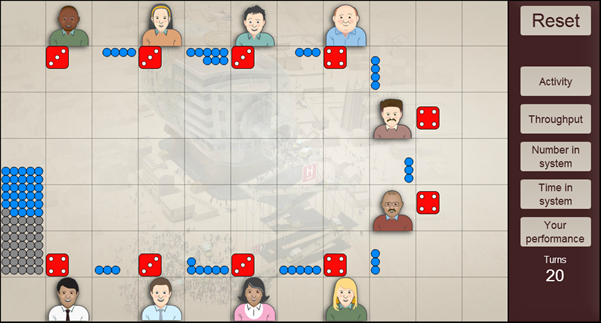
We have seen that random variations introduce temporary bottlenecks that reduce the capacity of the system. So it is reasonable to theorise that the effect of these bottlenecks can be reduced by reducing the amount of variability in the stages of the system; and this can indeed be the case. In the example below all ten workstations have a die that rolls either a 3 or 4, and 65 people have passed through the system. This is the same number as passed through in Game 2, but, you will notice, this hasn’t been achieved at the expense of work in progress in the system. You could reasonably expect the next 20 rounds to achieve a similar throughput.
 However, before embarking on the implementation such a strategy in the real world, it is worth investigating how incremental reduction in the variability of each of the stages affects the system performance. The plot below shows how the most likely throughput after 20 rounds changes as you introduce reduced variability into the system, starting at the first station.
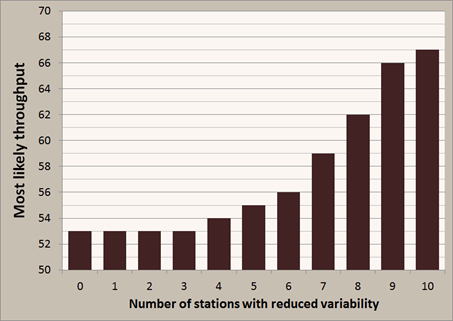 You can see that there is no apparent change until at least the first four stations have reduced variability. To achieve a 5% increase in most likely throughput requires you to have reduced variability in the first six stations. After this, the most likely throughput increases quite rapidly to the maximum increase of 26% over the base case. However, this is not the whole story. As you increase the number of stations with reduced variability, the most likely throughput does indeed increase, however, this is also accompanied by an increase in the variability of the throughput result, as shown in the plot below.
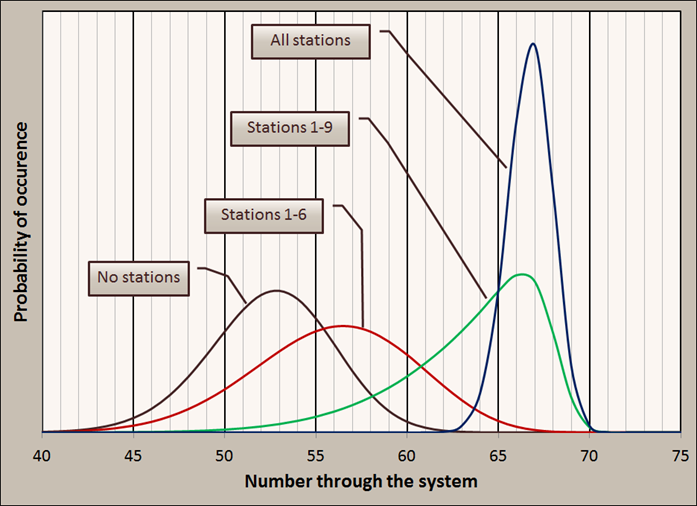 When stations 1 to 6 have reduced throughput, the peak does occur at a higher value than the case with no reduction. However, the spread of results is much wider meaning that you may have to plan for more uncertainty. This continues up until all the stations have reduced variability, at which point the spread in possible results drops dramatically.
In the dice game it is easy to reduce variability of the individual stations. In the real world, changing work practices over a number of tasks to reduce variability and ensure the same average throughput is often difficult and will take a long period of time to achieve. It can also result in some unexpected consequences.
However, before embarking on the implementation such a strategy in the real world, it is worth investigating how incremental reduction in the variability of each of the stages affects the system performance. The plot below shows how the most likely throughput after 20 rounds changes as you introduce reduced variability into the system, starting at the first station.
You can see that there is no apparent change until at least the first four stations have reduced variability. To achieve a 5% increase in most likely throughput requires you to have reduced variability in the first six stations. After this, the most likely throughput increases quite rapidly to the maximum increase of 26% over the base case. However, this is not the whole story. As you increase the number of stations with reduced variability, the most likely throughput does indeed increase, however, this is also accompanied by an increase in the variability of the throughput result, as shown in the plot below.
When stations 1 to 6 have reduced throughput, the peak does occur at a higher value than the case with no reduction. However, the spread of results is much wider meaning that you may have to plan for more uncertainty. This continues up until all the stations have reduced variability, at which point the spread in possible results drops dramatically.
In the dice game it is easy to reduce variability of the individual stations. In the real world, changing work practices over a number of tasks to reduce variability and ensure the same average throughput is often difficult and will take a long period of time to achieve. It can also result in some unexpected consequences.